
As for many other sectors of the economy, last year was a time of turmoil for solar PV, but this turmoil was not evenly distributed across all segments. Indeed, after six months full of uncertainties, the market proved its resilience, in all regions. One could even say that the market performed better than expected. Once again at the top of the charts, China installed more than 48 GWp, while other major markets maintained their performances of the previous year or even grew slightly, like Australia, Japan, Europe or the United States. Eventually, the Becquerel Institute estimates that between 130 to 140 GWp of solar PV were connected last year worldwide. In the European Union, it is estimated that approximately 16 GWp were installed. Adding the contribution of countries like Norway, Turkey, Russia, Switzerland or Ukraine, this figure could reach 22 to 23 GWp.
This positive note does not apply to all segments of the value chain, as mentioned previously. When looking upstream, i.e. on the manufacturing side, things are somewhat gloomier. Of course, in terms of technological developments, last year was exciting, with innovations hitting the market, such as 182mm and 210mm wafers and cells, for instance. Although, in terms of prices, this is another story. In the third quarter of 2020, the price of high purity polysilicon rose significantly from around 6,4 USD/kg at the beginning of July to 10,9 USD/kg by the end of August. This can be explained by various unexpected events occurring simultaneously at different major Chinese production sites, like fires or floods. Surprisingly, this proved to be a lasting trend, as prices started decreasing again only by December. Moreover, they remain at a high level compared to those witnessed in the first half of 2020.
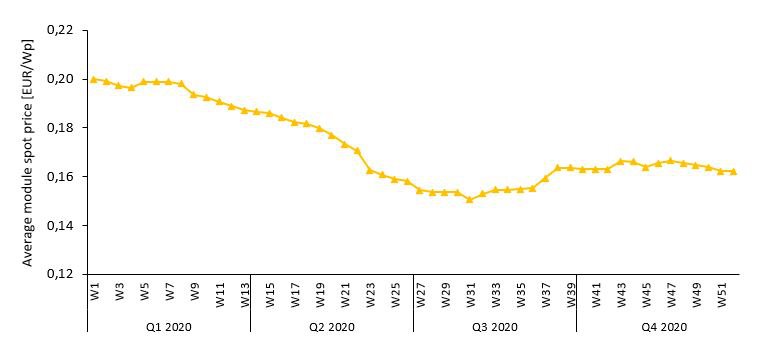
At other steps of the manufacturing value chain, instability appeared as well, like a propagating shockwave of the spike of polysilicon prices. In the first half of the year, the decrease of wafers, cells and modules spot prices initiated around March-April 2020 can largely be attributed to the decreasing downstream demand caused by the Covid-19 pandemic. By August-September, spot prices started rising again, thanks to the increasing downstream demand following the easing of restrictions linked to the pandemic and the impact on polysilicon prices.
Focusing on PV modules, the significant spot prices’ increase observable in Q3 can be explained by an additional factor. Indeed, this period also saw the appearance of tensions in the procurement of one of the key non-active materials used in solar PV module: glass. Starting in the middle of Q3 2020, solar glass spot prices started skyrocketing. The reason for that is the combination of an increasing demand for solar glass (driven by the typical rush in installations in Q4, especially in China, and by the increasing interest for larger and/or bifacial modules caused by the Chinese Front-Runner Program) as well as a stagnating supply (due to the capping of domestic glass production capacities by the Chinese government).
Today, the situation cooled down and PV modules spot prices seem to have reached a plateau. Although, it is expected that it will take months for them to reach the bottom level witnessed in early Q3 2020, if only possible in 2021. Such unexpectedly high PV module prices, if they maintain throughout the year, can threaten PV market development, by forcing some developers to delay their projects. Hence, the PV market might not perform as well as expected. Still, it is eventually foreseen that the PV capacity installed globally in 2021 should be at least equal to 2020’s figure. For example, in its new publication “European PV Market Report”, the Becquerel Institute anticipates a slightly increasing market in Europe, at approximately 24 GWp.